Mapping Montana
Know before you go.
Before a hunting excursion, mountaineering expedition, or even a simple road trip, there’s a certain romance in spreading out a map and plotting your journey. There’s boundless information piled onto a single piece of paper: jagged peaks and mountain passes, stacked contour lines of steep hillsides, soft blue lakes scattered through alpine terrain, crooked roads like veins crossing the landscape. Every inch is precise enough to guide you, but just vague enough to leave plenty of room for adventure. Every time, there’s a feeling of endless possibility—like early explorers tracing dirty fingers across a tattered map, those few inches could contain miles of anything. And seeing the tiny footprint of Bozeman from a bird’s-eye view is always a reminder of how little of this great state we’ve actually explored—and the countless stretches of land still left to discover.
Anymore, like all things, technology is taking over. As with print and photography, the mapping industry is inexorably marching toward digitalization, replacing the spread-out map on the kitchen table with the glowing computer screen. But it’s not all bad: any nostalgia lost is being replaced by utility—for the weekend backpacker and lobbying conservationist alike. With advancements in technology and collaborative efforts between industry specialists, maps aren’t only directing travelers from here to there, but have become irreplaceable elements behind land management, resource planning, and conservation efforts.
Geographic information systems (GIS) are the technical foundation of mapping—GIS allows map creators to visualize patterns, trends, and changes over time for specific regions, then compare the relationships for the purpose of the project or study. Migration patterns, distribution of wildlife sightings, and models built to show water-level changes identifying areas in danger of flooding are just a few examples of what GIS technology can do.
Through tracking historical changes in the land from decades of imagery, the people in the mapping industry are working in a multi-faceted field that is a driving force behind conservation efforts and land-use planning. By collecting information about land use and ecological changes over time, GIS has become essential to creating an understanding of the condition of Earth’s natural resources. Conservation groups are relying on mapping projects with ever-increasing frequency to make resource-management decisions.
This is happening around the globe—with ongoing examples right in our own backyard. Cartography companies in and around Bozeman are working on projects involving natural-resource relationships and conservation planning across Montana. The GIS data they compile is used for land management, hunting/fishing advocacy, and lobbying efforts in congress.
Much of the data sets come from analyzing aerial photography, compiled on free databases such as Google Earth. Some data sets come from the field, but most cartographers aren’t stomping around the wetlands and backcountry with surveying equipment and cameras in hand. In the age of information, the use of pre-existing digital imagery provides a baseline for data to be compiled and utilized for different projects.
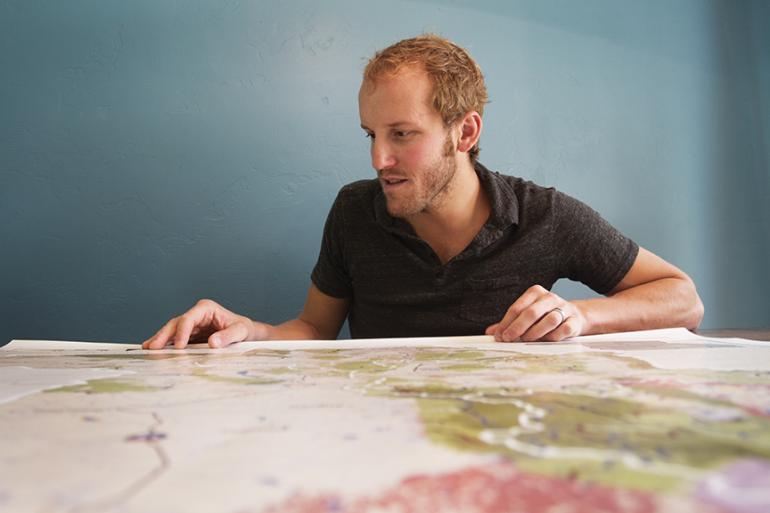
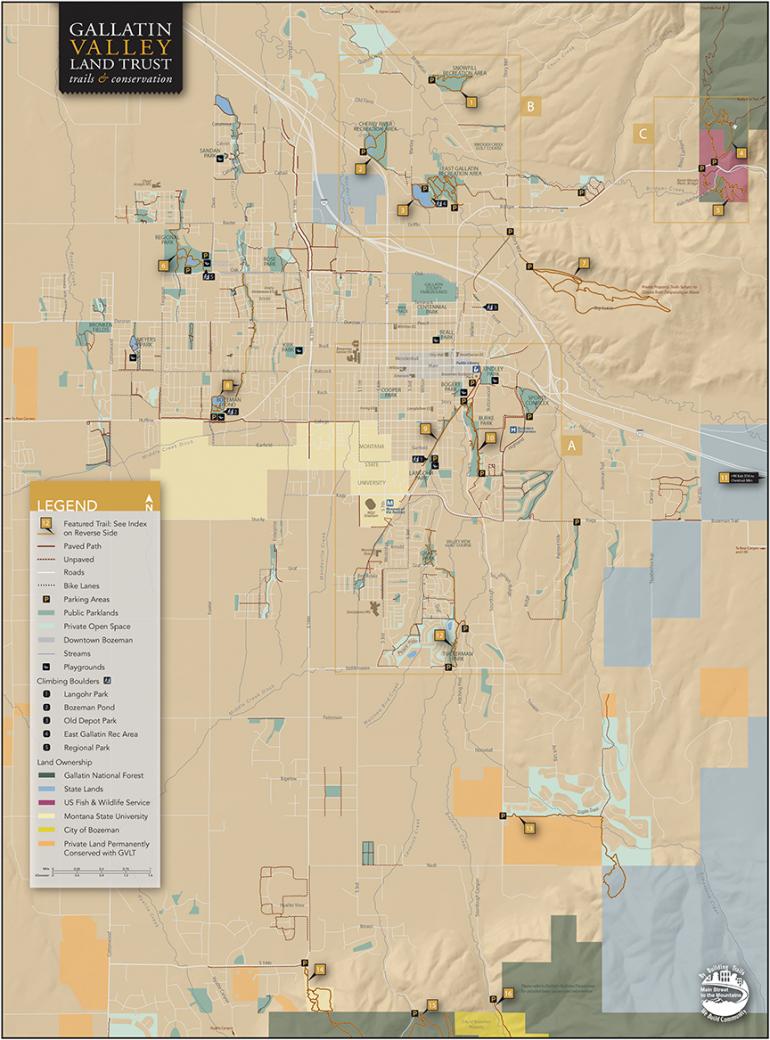
Josh Gage of Gage Cartographics has worked with the Sierra Club, World Wildlife Fund, and Gallatin Valley Land Trust using GIS technology to visually communicate projects and planning for these and other groups. But parked in his home office near downtown Bozeman, Gage sits at a long desk with three widescreen monitors humming, displaying different stages of compiling data and building maps. He has the healthy pallor of someone who spends most of his days outdoors—not in front of a computer screen.
Gage began working as a cartographer in grad school while pursuing a master’s degree in geography. He set out on his own several years ago, building business through word-of-mouth and continuing work with local organizations and nonprofits.
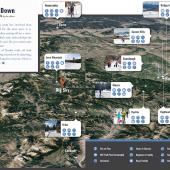
Josh leans into the middle screen and pulls up the Montana Sportsman’s Atlas, one of his recent projects. The website, a free resource for hunters in Montana, is an all-encompassing example of modern mapping technology. Contracted by Hellgate Hunters and Anglers out of Missoula, the idea behind the project was to provide hunters with information needed to plan their excursions. Detailed area maps can be overlaid with color-coded segments showing land ownership, hunting districts for different species, and block-management areas. The project was launched last year, and received nearly 10,000 visits in the first two weeks.
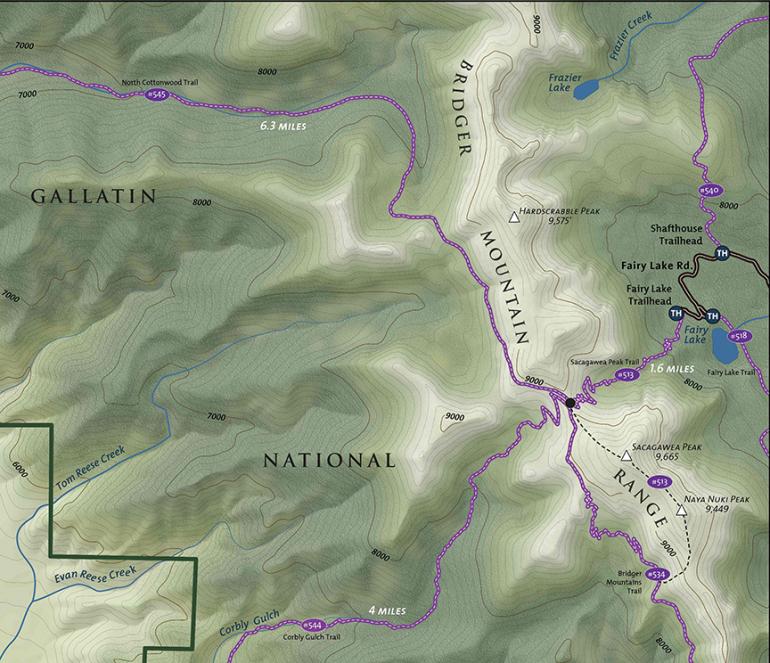
With a swipe of the mouse, Josh zooms in on a topo map of the Bridgers. He overlays the land ownership map with deer and elk hunting districts, showing the overlap between public lands and hunting districts. He clicks on hunting district 312, then pulls up a box with information about harvest regulations and hunting statistics for the area. Another click links to the FWP page for the highlighted region, should the user wish to pursue further information. Interactive maps such as this are the future of the industry—users would need hundreds of paper maps stacked on their kitchen table to communicate the amount of information available with a few clicks of a mouse.
Just a few blocks from Gage Cartographics, GIS specialist Tony Thatcher, owner of DTM Consulting, and his right-hand man Bryan Swindell sit in a brightly lit office with bookshelves full of print maps and industry texts. Like many of today’s geographic science companies, DTM works with different conservation groups and environmental planning development, using their experience and technology to creating multi-faceted visual references for a variety of projects.
For the past eight years, DTM worked on the Yellowstone River Cumulative Effects Study, a comprehensive analysis of the effects of human occupation on the Yellowstone River corridor. The result is a 100-plus-page report published this past January, including the extensive mapping and analysis of land use, river patterns, geology, and the socioeconomic factors driving river use. The report also shows settlement patterns and how those impact the health of the irreplaceable natural resource.
With involved, long-term mapping projects such as the Yellowstone River study, cartographers and GIS specialists often partner with other professionals to compile specific ecological or biological data needed to complete the report. From there, the relationships between GIS data, fish and wildlife populations, and socioeconomic factors are examined to give a complete, accurate representation of the area being studied.
For most commercial contracting companies, the presence of digital media has made web-based maps more powerful than printed ones. The interactive, dynamic nature of the internet and the sheer volume of data that can be compiled in a single project makes it an obvious choice for displaying the variety of information needed in these projects.
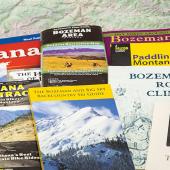
While maps and their commercial applications are moving towards the web, printed maps still have their place. Whether it’s for personal or commercial reasons, the demand is still there for the tangible, printed image that can’t be replaced by digital imagery. Campaign maps in poster form are important for public meetings, and conservation efforts can have a greater impact with physical reference point to display.
The modern mapping industry is exciting and progressive to follow. “The biggest challenge is that mapping science is moving like a steamroller,” says Tony. “Every time we come into the office, there’s an evolution in the technology, the data, and the thinking about what can be done with the data.”
More Gage Cartographic projects can be found at gagecartographics.com; DTM Consulting can be reached at dtmgis.com. For the hunters out there, plan your hunt with Montana Sportsman’s Atlas at map.mtbullypulpit.org.


